Debugging Linux Kernel using ftrace Part 2 - Function Tracer
To enable function tracer, echo "function" to current_tracer file.
$ echo "function" > current_tracer
$ echo "function" > current_tracer
$ cat current_tracer
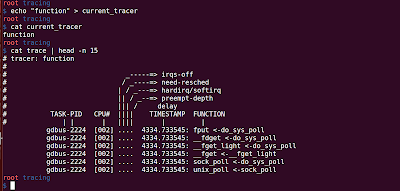
To see the kernel trace, cat "trace" file

You can see from the cat output:
- First line specifies the tracer installed, in our case "function"
- Next each line prints the following information:
- Process Name
- PID
- CPU that the trace executed on
- Timestamp in seconds with the decimal places to microseconds. This timestamp is time since boot
- Function being traced
- Parent that call the function


Hi! I really like your content Your post is really informative.
ReplyDeleteBest Machine Learning Course in Bangalore