Linux Device Driver example for dump_stack() to print the stack trace of module loading
One of the useful options in debugging is to print the call trace/stack trace. Linux kernel provides a function to print the stack trace: dump_stack().
Calling dump_stack() function will print the stack trace at that point.
Code:
Output:
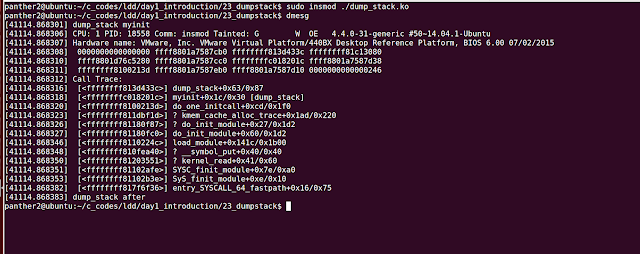
Calling dump_stack() function will print the stack trace at that point.
Code:
Output:


Comments
Post a Comment