Posts

Showing posts with the label debugging

Debugging Linux Kernel using ftrace Part21 - kernel function profiling

Image
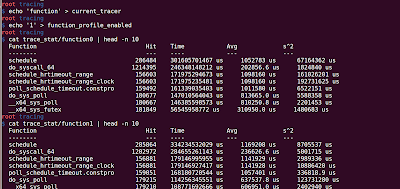
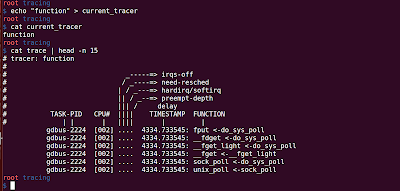
From Wikipedia, function profiling provides you the following : Space or Time Complexity of a Program Usage of Particular Instruction Frequency and duration of function calls ftrace can provide you the following function profiling information using 'function_profiling_enabled' file.  Frequency of function calls (When the tracer is 'function') Duration spent in each function calls (When the tracer is 'function_graph') Steps for Function profiling: 1. Enable the function tracer: 'function'/'function_graph' echo 'function' > current_tracer 2. Enable the function profiling: echo '1' > function_profiling_enabled To observe the results look into '/sys/kernel/tracing/trace_stat' folder. You will observe a lot of file with the following name: function<number> (e.g. function0, function1,...), where number represents the core on which the function is executing. So, if you have 4 Processors, funct...

Debugging Linux Kernel using ftrace Part 20 - Write into trace file from user space

Image
Writing to 'trace_marker' file from userspace will write into the ftrace ring buffer. 'trace_marker' and 'tracing_on'  help us find out what is happening inside the kernel at a particular line of the user space application. User Code: Output: Observation: You can see in the code, I want to observe what internally 'sleep' command does. But not sure in the trace file output, where the kernel functions related to sleep starts and ends. Writing to trace using the 'trace_marker' helps us to coordinate between user code and kernel code.

Debugging Linux Kernel using ftrace Part 19 - Finding Maximum Kernel Stack Size

Image
Kernel has a fixed stack size. The default stack size for process running in kernel is 8K. Call a function in recursion without any break, you will observe system will freeze within seconds. A kernel developer should be careful with what they are allocating on the stack. If he adds a lot to the kernel stack, stack overflow can happen and finally system panic. To enable the stack tracing functionality, echo 1 > /proc/sys/kernel/stack_tracer_enabled Wait for few minutes to get a better information. Files to look to get stack information: /sys/kernel/tracing/stack_max_size: Displays the maximum size it has encountered /sys/kernel/tracing/stack_trace: Displays the backtrace of the largest stack trace encountered after activating stack tracer /sys/kernel/tracing/stack_trace_filter: Limits what functions stack tracer will check, it is similar to "set_ftrace_filter"

Debugging Linux Kernel using ftrace Part17 - Finding out how user space code gets into kernel

Image
We can find out what is the first kernel function called when the user space code gets into the kernel using 'max_graph_depth' file. This file can only be used with the function tracer. max_graph_depth file contains the maximum depth it will trace into a function. Default value is 0, which means unlimited. If you 'echo 1 > max_graph_depth', it will only the trace the first function and ignore the other functions. You can see, 'do_syscall_64()' is the function through which the user space code gets into the kernel space. If we want to find out the next function after 'do_syscall_64()', 'echo 2 > max_graph_depth'

Debugging Linux Kernel using ftrace Part16- Disabling interrupts info in function graph

Image
The function graph tracer also traces the interrupts. You can tell the function graph tracer to disable tracing of interrupts by writing 0 in 'options/funcgraph-irqs' file. $ echo 0 > options/funcgraph-irqs The below screenshot is before disabling interrupts. After I disable interrupts, there is no tracing information related to interrupts (e.g. smp_apic_timer_interrupt).

Debugging Linux Kernel using ftrace Part15 - trace_options

Image
'trace_options' file allows user to control the level of information displayed when we do cat on 'trace' or 'trace_file' You can see from the above screenshot, There are 26 options available for the user to control. There are some tracer specific options which are not listed in this file and are present in 'options' directory. The words which begin with "no" represents trace options that are disabled. To enable an option. $ echo 'sym-offset' > trace_options To disable an option, add "no" $ echo 'nosym-offset' > trace_options. Let's try some of the options. 1. sym-offset: Enabling this option, you will see function name plus offset in the function. By default, this is disabled. 2. print-parent: This option displays the calling function. By default, this option is disabled. 3. function-fork: This option enables tracing the children when set_ftrace_pid is set. 4. irq-info: ...

Debugging Linux Kernel using ftrace Part14 - Measuring scheduling latency

Image
ftrace provides "wakeup" tracer to find the scheduling latency. This tracer only records the latency for the highest priority to get scheduled after it woken up. Scheduling latency: Time from the wakeup event until the task actually gets the CPU and begins to run. You can see from the above screenshot, i wrote a simple program which calls "sleep" to voluntarily leave the CPU from the 'wakeup' process and to give it to another process for us to find out the scheduling latency. It took '30us' for scheduling the next highest priority task.

Commonly used gdb commands

1. Starting up gdb : gdb <Executable name with debugging symbols> If you run only gdb, you can still specify file name using the 'file' command $gdb (gdb) file </path/to/executable> 2. Help of command: To get help of a particular command use "help" command (gdb) help [command] 3. Running the program:  (gdb) run 4. Setting breakpoints: Breakpoints are used to stop the program run in the middle, at a designated point. (gdb) break file1.c:10 The above command puts breakpoint at line 10 of file1.c (gdb) break <func_name> The above command puts breakpoint at the starting of this function 5. Continue the Program: After breakpoint, if you type 'run' it will start executing from beginning, instead of that to continue from the breakpoint, use "continue". Program will run until the next breakpoint or program termination (gdb) continue 6. Single Stepping: After breakpoint, if you want to single step to next line, instead o...

Debugging Linux Kernel using ftrace Part13 - Finding out maximum time interrupts are disabled

Image
When interrupts are disabled, CPU cannot react to any external events: timer interrupts mouse interrupts irqsoff is a tracer which tracks the times in the kernel when interrupts are disabled. Whenever a new maximum latency is found, the tracer saves the trace leading up to that latency point. Each time a new maximum latency is reached, the old saved trace is discarded and the new trace is saved. By default this tracer is not enabled in my kernel, I had to re-compile my linux kernel with the following kernel configuration: "CONFIG_IRQSOFF_TRACER" You can see from the above screenshot, the maximum latency found was 644ms, started at _raw_spin_lock_irq.  Also , 'tracing_max_latency' file also provides you the maximum latency when the interrupts are disabled. Next time, trace file will be updated when it finds a latency greater than the value present in 'tracing_max_latency' file. To reset the maximum latency, write '0' in 'tracing_ma...

Debugging Linux Kernel using ftrace Part12 - Finding kernel functions taking > 10ms

Image
ftrace uses 'tracing_thresh' file and compare the function duration if  greater than the value present in the file, it logs tracing entries in the ring buffer. By default the value is zero, it means ftrace doesn't care this. The value written in 'tracing_thresh' is in microseconds. So, if you want to find out the kernel functions which are taking more than 10ms , you need to write echo '10000' > tracing_thresh Set back zero in tracing_thresh, if you want to trace all the functions. echo '0' > tracing_thresh

Debugging Linux Kernel using ftrace Part11 - What calls made by a kernel function

Image
In the previous post we have seen how to find out the backtrace of a particular function. In this post, we will learn on what all functions are being called by a particular function. The file for this is 'set_graph_function' and tracer is 'function_graph' Let's find out what all calls are made by 'vfs_read'. You can see from the above screenshot, vfs_read calls many functions for a read operation

Debugging Linux Kernel using ftrace Part10 - Who calls this kernel function

Image
With ftrace, you can find out who is calling a particular kernel function. "function" tracer contains an option which creates backtrace for each function called by tracer. If you enable this option without any filter, chances are that your system will get into live lock. Note: You can use this feature only when the tracer is "function". Let's track who all calls "vfs_read". From the above steps, I did the following:  Set the tracer to "function"  Added "vfs_read" as a filter Enabled the function back trace option in "options" directory You can see the flow: system call -> ksys_read -> vfs_read. 

Debugging Linux Kernel using ftrace Part9 - Start tracing on a particular function

Image
We know 'tracing_on' file is used to disable/enable writing the traces on the ring buffer. echo '0' > tracing_on //to disable tracing echo '1' > tracing_on // to enable tracing ftrace also provides functionality to start tracing on a particular function call execution or stop tracing on a particular function execution. Syntax: function:command[:count] The command will be executed on the start of the function. The value of command can be "traceon" to start the trace or "traceoff" to stop the trace, or it can be "stacktrace". The count is optional, specifies the number of times the command should be executed. If there is no count specified, the command will be executed each time the function is called. From the above screenshot, i told ftrace to stop tracing on ksys_read, which is called when user space calls read, and start tracing on ksys_write, which is called when user space calls write.

Debugging Linux Kernel using ftrace Part8 - Trace all functions related to a specific module

Image
In our previous post, we discussed how to trace only specific kernel functions by echoing them into "set_ftrace_filter" file. To list what all functions the ftrace can trace, you can read "available_filter_functions" file. $ wc -l available_filter_functions 38750 available_filter_functions You can see from the above output there are more than 38000 functions which the ftrace is tracing if we don't add filters. The tracing files support wild cards,  the following expressions are valid: value* - Will select all functions that start with string "value" *value - Will select all functions that end with string "value" *value* - Will select all functions that start and end with string "value" As the star (*) is used by bash, you have to wrap the string in quotes when using wild cards. To trace all functions of a specific module, for example e1000 (Ethernet driver) you can pass the following to set_ftrace_filter. ...

Debugging Linux Kernel using ftrace Part6 - trace vs trace_pipe

Image
ftrace internally uses a ring buffer of fixed size. The size can be find out by reading "buffer_size_kb" file. If the buffer becomes full, it will overwrite the starting tracing entries. $ cat buffer_size_kb 1410 To read this ring buffer, we can cat either of the two files present in /sys/kernel/tracing folder: trace trace_pipe What is difference between trace and trace_pipe? Difference between the two files is that "trace" file is static. Each time you read the contents of "trace" file it will print the same tracing entries, whereas with trace_pipe, each time you read the file the data is consumed, and in the next read data will be different also if there is no data trace_pipe will block. Let's try to understand by running the commands. You can see, I did the following steps: Enabled the "function_graph" tracer Then I read both the "trace" and "trace_pipe" files, it displayed the sam...

Debugging Linux Kernel using ftrace Part5 - trace_printk

Image
ftrace has introduced a new form of printk - trace_printk. The problem with the current printk() is Using printk in interrupt context such as timer interrupts, scheduler, network can create a live lock Sometimes bug disappear when we add few printk's if something is time sensitive printk when writing to the serial console may take several milliseconds With trace_printk writing will be in the order of microseconds as it writes to a ring buffer instead of console can be used in any context (interrupt, scheduler, NMI Code) can be read via the 'trace' file Let's update our Keyboard character press driver code to use trace_printk instead of printk. Code: Output:

Debugging Linux Kernel using ftrace Part4 - Tracing a specific Process

Image
With ftrace, we can trace kernel calls only related to a specific process by echoing pid in the set_ftrace_pid file. Steps to trace kernel calls of a particular PID: 1. Disable tracing by echoing "nop" to "current_tracer" file $ echo "nop" > current_tracer $ cat current_tracer  nop 2. Echo the pid of the process which you want to trace in "set_ftrace_pid" file. 2588 is the pid of "gnome-terminal" $ echo "2588" > set_ftrace_pid $ cat set_ftrace_pid  2588 3. Enable either "function" or "function_tracer" by echoing into "current_tracer" file $ echo "function_graph" > current_tracer  4. You can now "cat trace" to see what all kernel functions are being executed by the gnome-terminal. You can also find out what all kernel function calls being executed by the running bash  $ echo "$$" > set_ftrace_pid The ...

Debugging Linux Kernel using ftrace Part3 - Function Graph

Image
Information provided by "function" tracer is a bit hard to follow. "function_graph" is another which tracks the entry of the function tracks the exit of the function Execution Time CPU on which it is running With "function graph" tracer, you can easily follow the flow of execution within the kernel To use function graph, $ echo function_graph > current_tracer and then cat the trace file. Start of the function is denoted with '{' and end of the function is denoted with '}'.  Functions that do not call any other functions, simply end with ';', also called as leaf functions Duration column reports the time spent in the corresponding function. These numbers are only for the leaf functions, and the '}' symbol. When the duration is greater than 10 microseconds, a '+' is shown in the DURATION column When the duration is greater than 100 microseconds, a '-' is shown in DURATION column ...

Debugging Linux Kernel using ftrace Part 2 - Function Tracer

Image
To enable function tracer, echo "function" to current_tracer file. $ echo "function" > current_tracer $ cat current_tracer To see the kernel trace, cat "trace" file You can see from the cat output: First line specifies the tracer installed, in our case "function" Next each line prints the following information: Process Name PID CPU that the trace executed on Timestamp in seconds with the decimal places to microseconds. This timestamp is time since boot Function being traced Parent that call the function

Debugging Linux Kernel using ftrace Part1 - Introduction

Image
What is Tracing? From Wikipedia, tracing is specialized use of logging to record information about program's execution. This logged information is used by programmers for debugging. What is ftrace? ftrace stands for function tracer. ftrace allows you to trace kernel function calls (entry and exit of function calls). What can we do using ftrace? Debugging Linux Kernel Analyzing Latencies in Linux Kernel Learn and observe the flow of Linux Kernel Trace context switches Length of the time the interrupts are disabled What is the minimum kernel configuration required for ftrace? CONFIG_FTRACE --> "Tracers" CONFIG_FUNCTION_TRACER --> Kernel Function Tracer CONFIG_FUNCTION_GRAPH_TRACER --> Kernel Function Graph Tracer CONFIG_DYNAMIC_TRACEV --> Enable/Disable ftrace dynamically How to check whether ftrace is already enab led or not? Most of the Linux distributions already provide ftrace, to check verify "tracing" dir...