Debugging Linux Kernel using ftrace Part12 - Finding kernel functions taking > 10ms
ftrace uses 'tracing_thresh' file and compare the function duration if greater than the value present in the file, it logs tracing entries in the ring buffer. By default the value is zero, it means ftrace doesn't care this. The value written in 'tracing_thresh' is in microseconds.
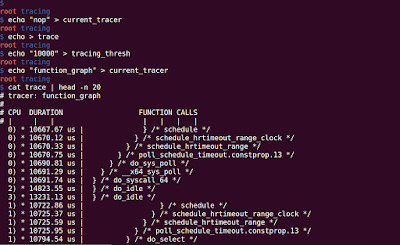
So, if you want to find out the kernel functions which are taking more than 10ms , you need to write
echo '10000' > tracing_thresh

Set back zero in tracing_thresh, if you want to trace all the functions.
echo '0' > tracing_thresh

Comments
Post a Comment