Debugging Linux Kernel using ftrace Part3 - Function Graph
Information provided by "function" tracer is a bit hard to follow. "function_graph" is another which
- tracks the entry of the function
- tracks the exit of the function
- Execution Time
- CPU on which it is running
With "function graph" tracer, you can easily follow the flow of execution within the kernel
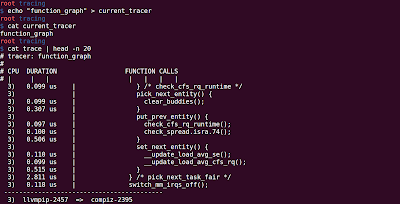
To use function graph, $ echo function_graph > current_tracer and then cat the trace file.

- Start of the function is denoted with '{' and end of the function is denoted with '}'.
- Functions that do not call any other functions, simply end with ';', also called as leaf functions
- Duration column reports the time spent in the corresponding function. These numbers are only for the leaf functions, and the '}' symbol.
- When the duration is greater than 10 microseconds, a '+' is shown in the DURATION column
- When the duration is greater than 100 microseconds, a '-' is shown in DURATION column
- When the duration is greater than 1000 microseconds, a '#' is shown in DURATION column
- When the duration is greater than 10 milliseconds, a '*' is shown in DURATION column
- When the duration is greater than 100 milliseconds, a '@' is shown in DURATION column
- When the duration is greater than 1 seconds, a '$' is shown in DURATION column


ui path training
ReplyDelete