Debugging Linux Kernel using ftrace Part 18 - Starting ftrace at boot
Kernel provides many command-line parameters for ftrace.
1. ftrace = [tracer] : This will set and start the tracer as early as possible in boot
2. ftrace_dump_on_oops : This will print oops message on kernel panic or on oops
3. ftrace_filter=[function_list]: Function-list is a comma-separated list of functions. Traces only the functions present in the filter at boot.
4. ftrace_graph_filter=[function_list]: Limits the top level callers functions traced by function graph tracer
5. ftrace_notrace, ftrace_graph_notrace=[function_list]: Opposite of ftrace_filter, and ftrace_graph_filter. Will not trace the functions listed in this parameter.
6. ftrace_graph_max_depth=<uint>: Used along with function graph tracer. This is max depth it will trace into the function
7. tracing_thresh=<uint>: Will trace only the functions taking longer than passed values.
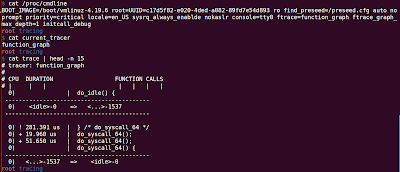
Let's add the following command line parameters to kernel:
ftrace=function_graph ftrace_graph_max_depth=1
This tells the kernel to start 'function_graph' tracer on start and maximum depth of tracing into function is 1.
1. ftrace = [tracer] : This will set and start the tracer as early as possible in boot
2. ftrace_dump_on_oops : This will print oops message on kernel panic or on oops
3. ftrace_filter=[function_list]: Function-list is a comma-separated list of functions. Traces only the functions present in the filter at boot.
4. ftrace_graph_filter=[function_list]: Limits the top level callers functions traced by function graph tracer
5. ftrace_notrace, ftrace_graph_notrace=[function_list]: Opposite of ftrace_filter, and ftrace_graph_filter. Will not trace the functions listed in this parameter.
6. ftrace_graph_max_depth=<uint>: Used along with function graph tracer. This is max depth it will trace into the function
7. tracing_thresh=<uint>: Will trace only the functions taking longer than passed values.
Let's add the following command line parameters to kernel:
ftrace=function_graph ftrace_graph_max_depth=1
This tells the kernel to start 'function_graph' tracer on start and maximum depth of tracing into function is 1.


Comments
Post a Comment