Debugging Linux Kernel using KGDB Part8 - Debugging Kernel Module
In this post, we will debug the e1000 module present on our Ubuntu VM.
Steps for debugging using KGDB:
On the target:
gdb client needs to know the load address of the kernel module
$ cat /sys/module/e1000/sections/.text
0xffffffffc0091000
Switch to KGDB Debugger mode by activating magic sysrq
$ echo 'ttyS1,115200' > /sys/module/kgdboc/parameters/kgdboc
$ echo g > /proc/sysrq-trigger
On the Development Machine:
Run the following commands:
$ gdb ./vmlinux
$ target remote /dev/ttyS1
$ add-symbol-file drivers/net/ethernet/intel/e1000/e1000.ko 0xffffffffc0091000
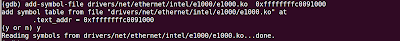
Let's put breakpoint at e1000_xmit_frame which is called while transmitting a frame.
(gdb) break e1000_xmit_frame
Breakpoint 1 at 0xffffffffc0092f90: file drivers/net/ethernet/intel/e1000/e1000_main.c, line 3102.

Steps for debugging using KGDB:
On the target:
gdb client needs to know the load address of the kernel module
$ cat /sys/module/e1000/sections/.text
0xffffffffc0091000
$ echo 'ttyS1,115200' > /sys/module/kgdboc/parameters/kgdboc
$ echo g > /proc/sysrq-trigger
On the Development Machine:
Run the following commands:
$ gdb ./vmlinux
$ target remote /dev/ttyS1
$ add-symbol-file drivers/net/ethernet/intel/e1000/e1000.ko 0xffffffffc0091000
Let's put breakpoint at e1000_xmit_frame which is called while transmitting a frame.
(gdb) break e1000_xmit_frame
Breakpoint 1 at 0xffffffffc0092f90: file drivers/net/ethernet/intel/e1000/e1000_main.c, line 3102.
(gdb) c
Now see as soon as it transmits a packet, system will stop and enter into kgdb session


Thank you for sharing this! What you have shared is very helpful and informative. Would love to see more updates from you.
ReplyDeleteWebsite Development
The tutorials are very helpful,thanks.
ReplyDeleteI tried the same steps as mentioned in tutorial but facing some issues.
When i insmod the kernel module on target(Beagle-Bone),i don't see a .text section under /sys/module//sections/.
Any input on this will be helpful.
The below command also gives the module's loaded address
Delete```
$ sudo grep MODULE_NAME /proc/modules
```