Debugging Linux Kernel using SystemTap Part-7 - Timer
Systemtap provides an easy way to run your code after a specified time period by providing timers.
timer.ms(N) - Probe every N milliseconds
timer.s(N) - Probe every N seconds
timer.us(N) - Probe every N microseconds
timer.ns(N) - Probe every N nanoseconds
timer.hz(N) - N probes per second
Let's write a handler which fires every two seconds.
probe timer.s(2)
{
printf("Time:%s\n", ctime(gettimeofday_s()))
}
O/P: gettimeofday_s() returns the number of seconds since epoch time and ctime() converts this epoch time date
You can see the printf statement is executing for every two seconds
You can see the printf statement is executing for every two seconds

There is another API provided by systemtap: timer.profile , it's a timer that fires periodically on every CPU. Handlers for this probe are called on each CPU for every timer interrupt.
probe timer.profile
{
printf("Time:%s\t CPU:%d\texecname:%s\n", ctime(gettimeofday_s()), cpu(), execname())
}
cpu() will print the CPU number on which the timer fired and execname() will tell the name of the process.

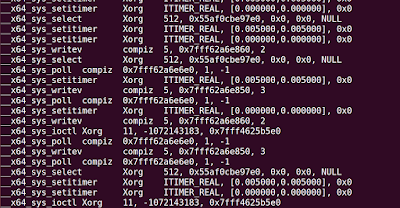
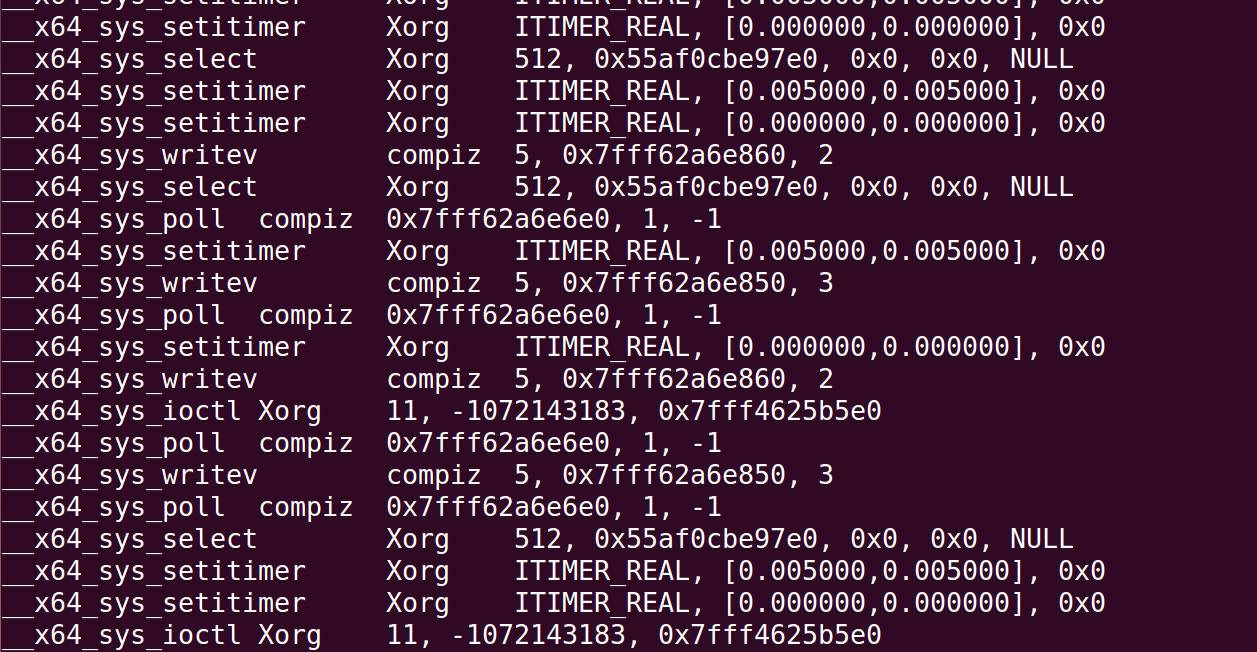
Combining from what we have learnt previously, let's write a script which prints all the system calls being called in 2 seconds
probe timer.s(2)
{
exit()
}
probe syscall.*.call
{
printf("%s\t%s\t%s\n", ppfunc(), execname(), argstr)
}
The timer fires after 2 second, and we call exit() to stop the execution of SystemTap script.

Comments
Post a Comment